Contents

Dashboard purpose

StudioDash is built around a dashboard-first operating view. Instead of opening several provider consoles to understand what changed, developers can review a unified workspace that highlights revenue, app status, website activity, provider health, and sync state.

The dashboard is designed for fast scanning first, then deeper review through dedicated pages for revenue, apps, website analytics, integrations, and reporting.

Dashboard signals

The dashboard brings together current operational state and selected-period analytics. Some signals are current-state values, while historical metrics can be filtered by period where provider data is available.

  • Revenue totals and provider breakdowns.
  • Downloads, app status, lifecycle, ratings, and reviews where available.
  • Website traffic, search clicks, impressions, indexing, and validation signals.
  • Provider health, attention items, and sync status.
  • Trend summaries for recent performance changes.

Demo and live context

StudioDash documentation separates product direction from public availability. The app includes demo and live data concepts in the product, but public website copy does not treat demo values as live customer data.

When provider data is unavailable, StudioDash is designed to keep the relevant cards visible with clear setup or no-data messaging rather than hiding the surface or implying data exists.

Daily operating view

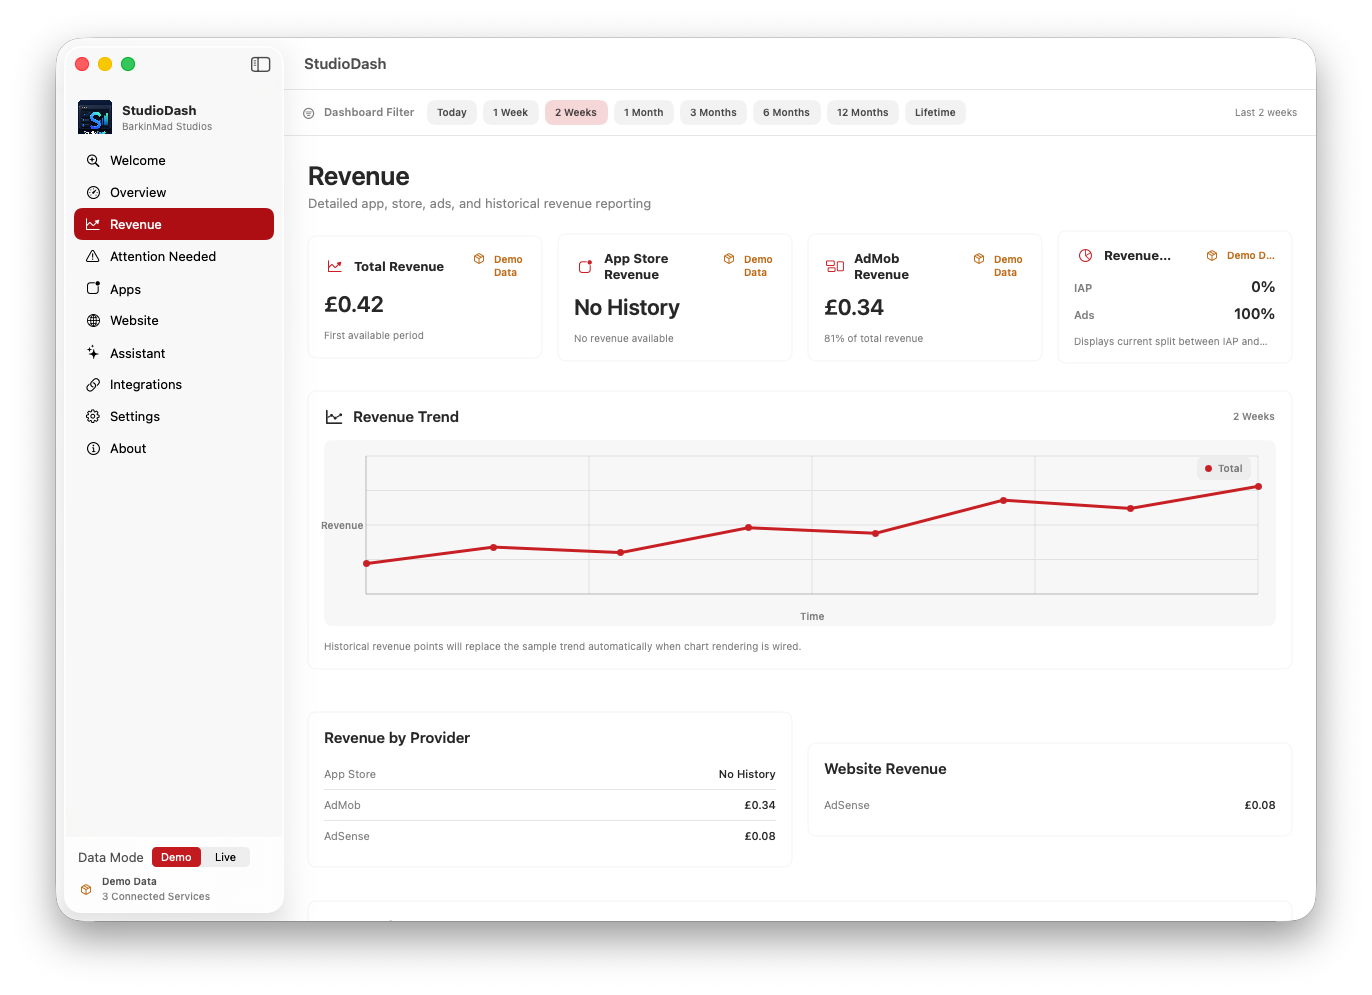
The dashboard screen is the starting point for reviewing app, revenue, website, provider, sync, and trend signals.

This screen solves the common problem of scattered operational data. Developers can begin with a single workspace, see whether a product or provider needs attention, and then open the specialist analytics page that explains the change.

  • Highlights revenue, app status, website activity, provider health, and sync state.
  • Keeps cards visible when setup or provider data is missing.
  • Connects daily review to dedicated analytics and reporting pages.
StudioDash daily dashboard with revenue, app status, website activity, provider health, and sync cards
The dashboard is designed for fast scanning before deeper analysis.